TL;DR

A rapid design sprint to deliver a data-intensive EV Analytics dashboard under tight deadlines. Collaborated with PM and Data Analysts to balance technical feasibility and usability, creating a high-fidelity prototype that helped secure client trust and align engineering execution.

Background

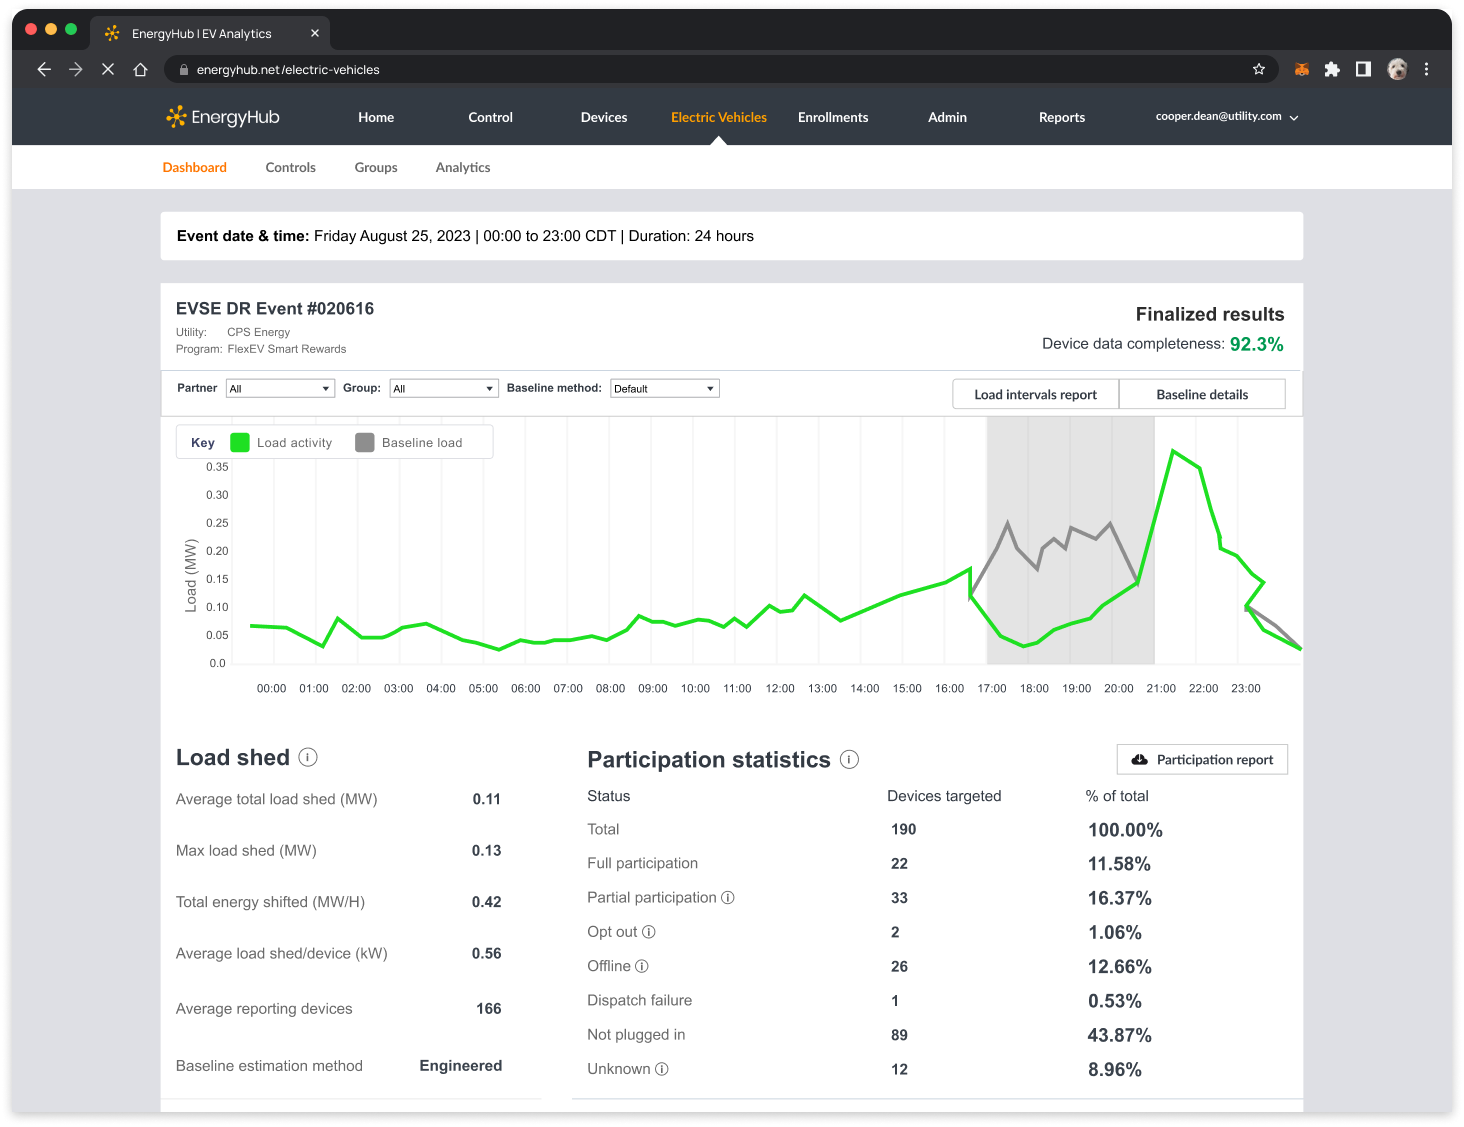
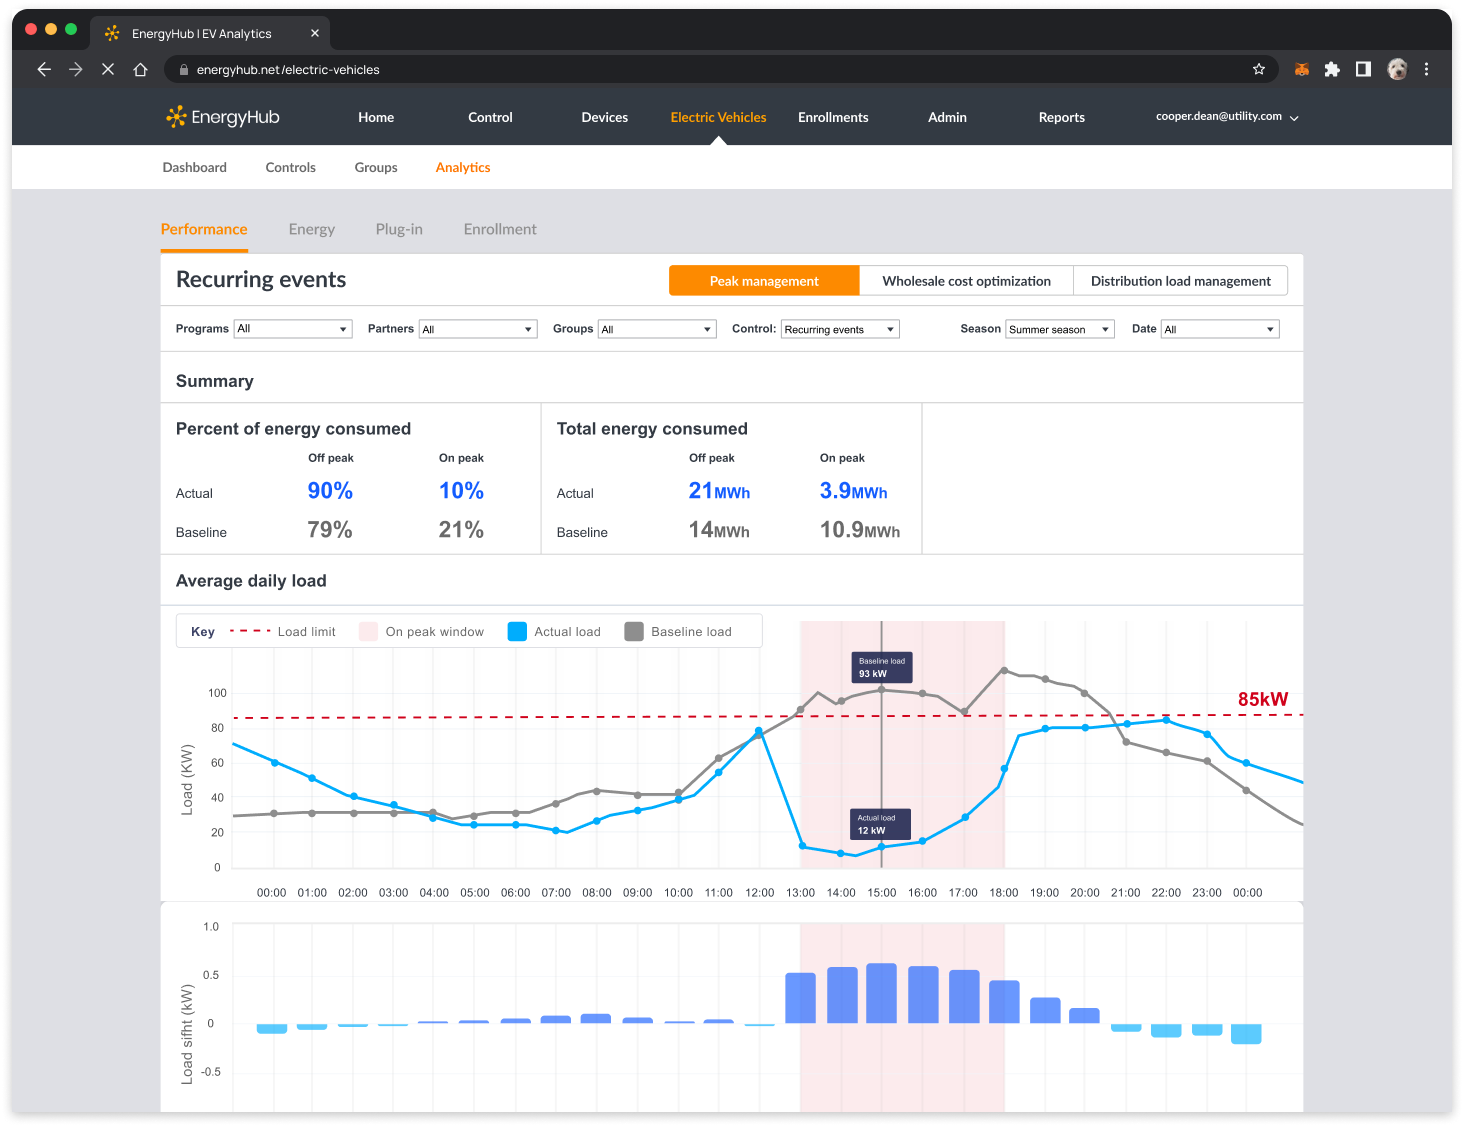
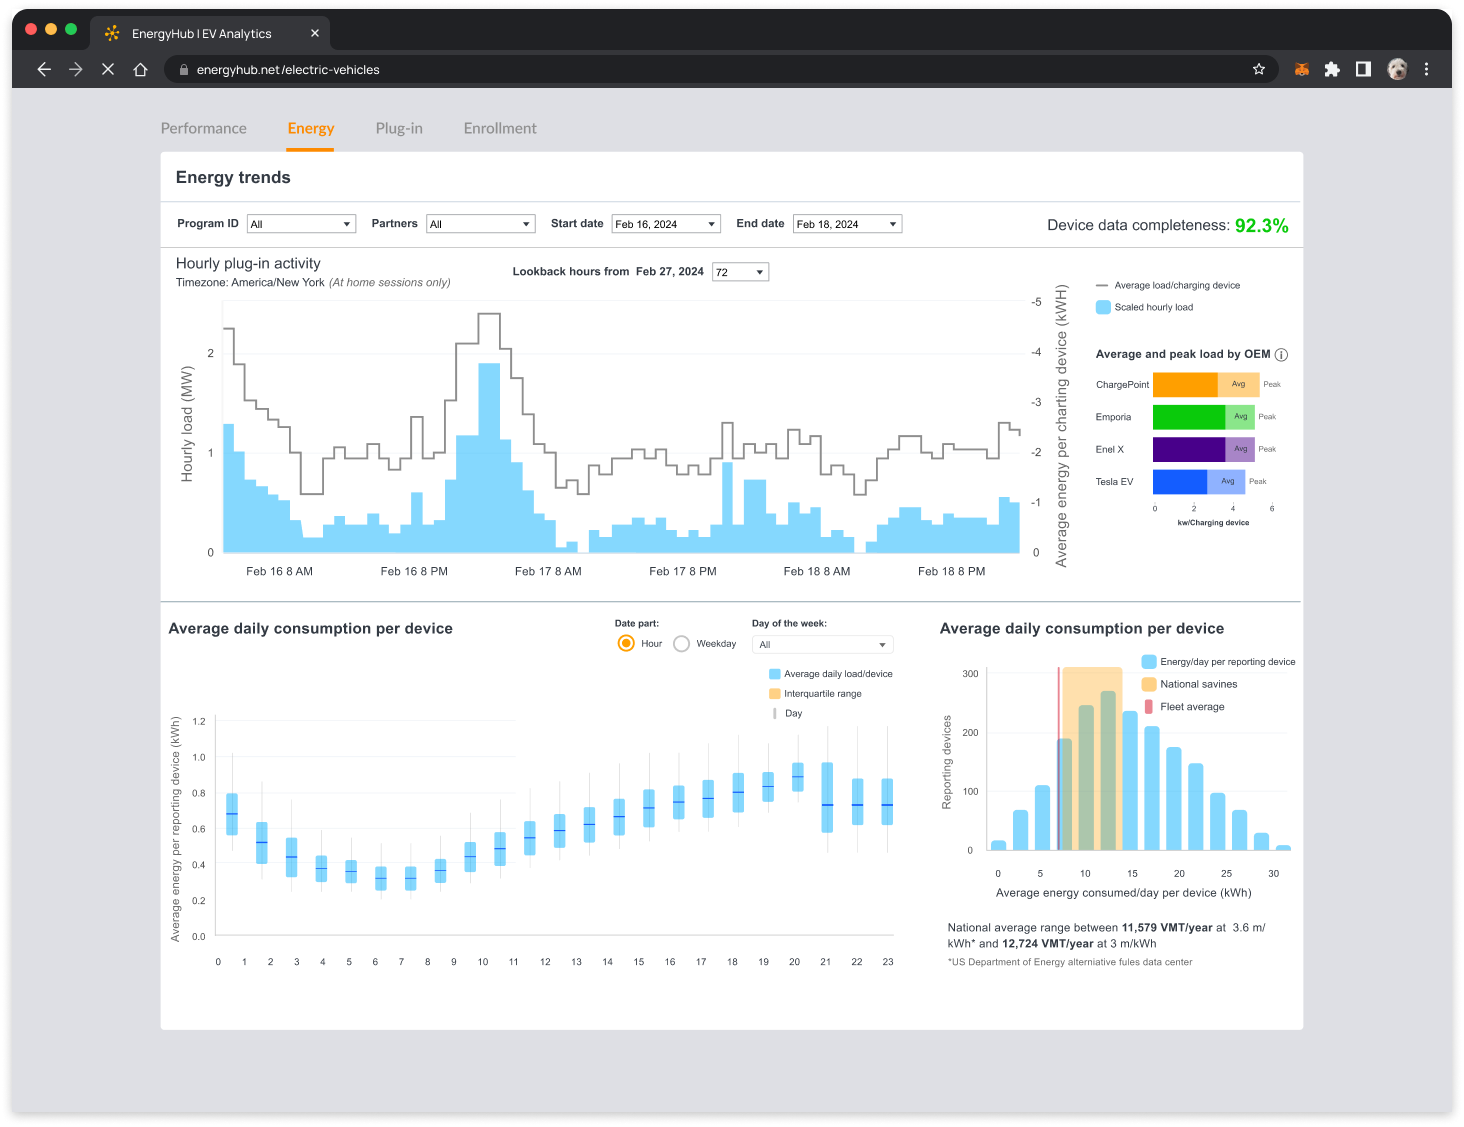
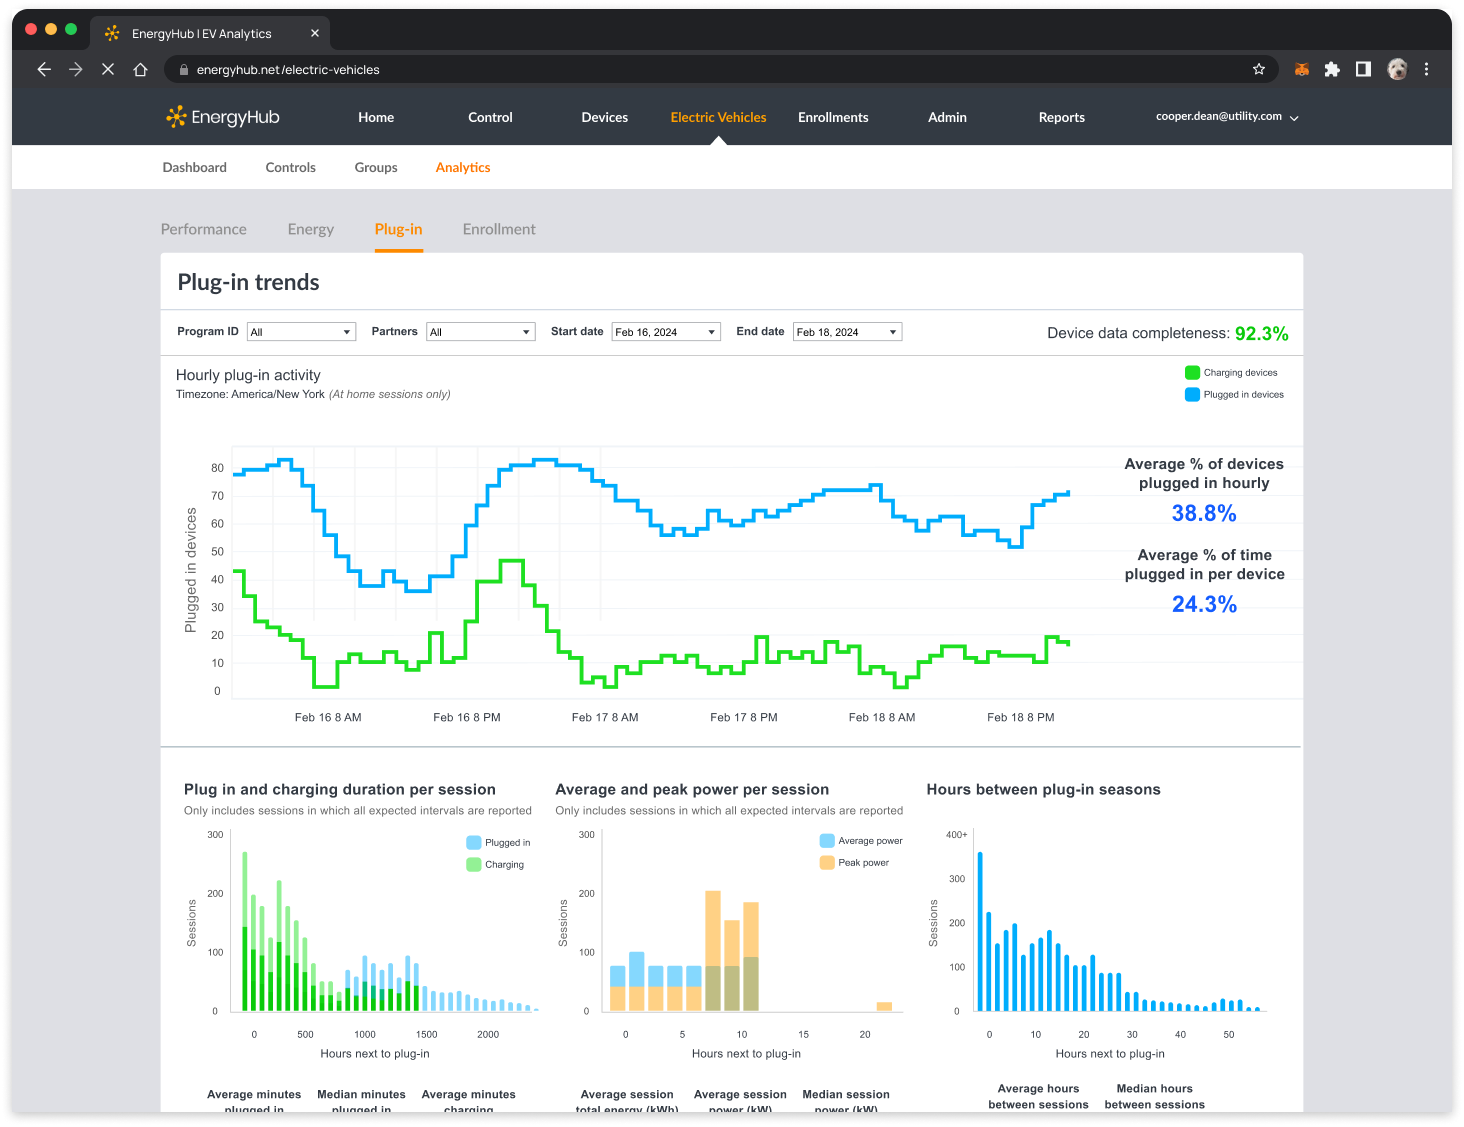
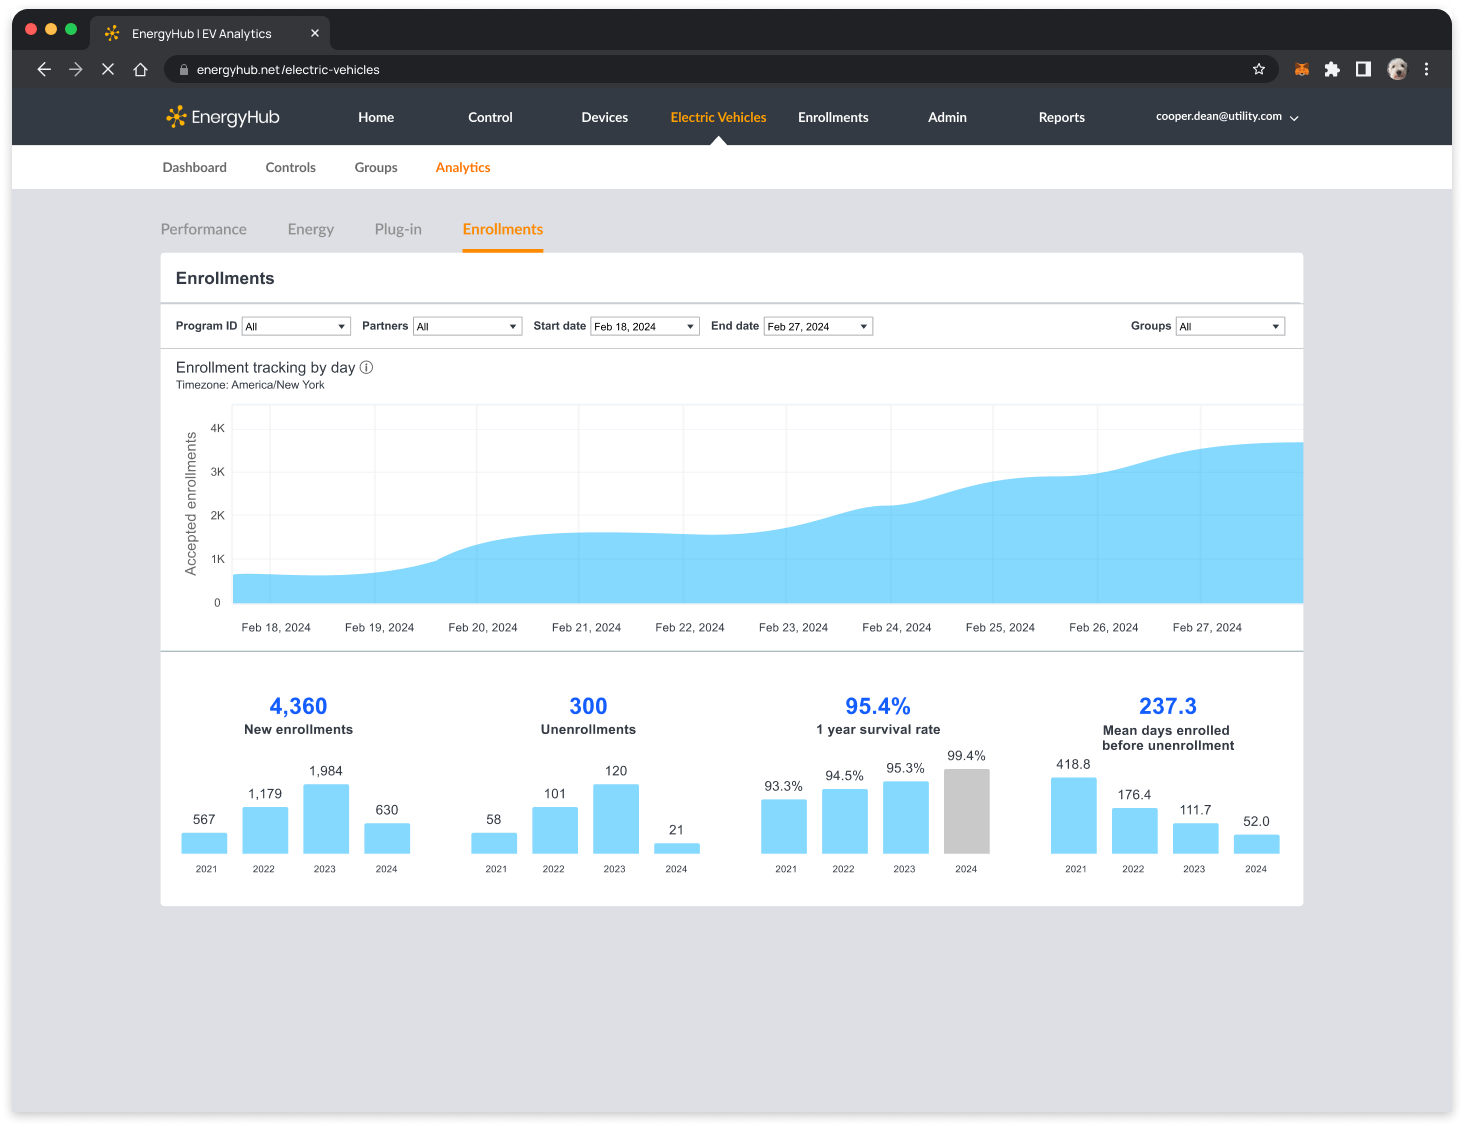
A fast-paced, high-impact project designing a new EV Analytics feature within the Utility Web Portal (UWP). Brought in post-ideation, I helped distill complex datasets into actionable insights while navigating constraints from business, data, and design systems.

Project challenge

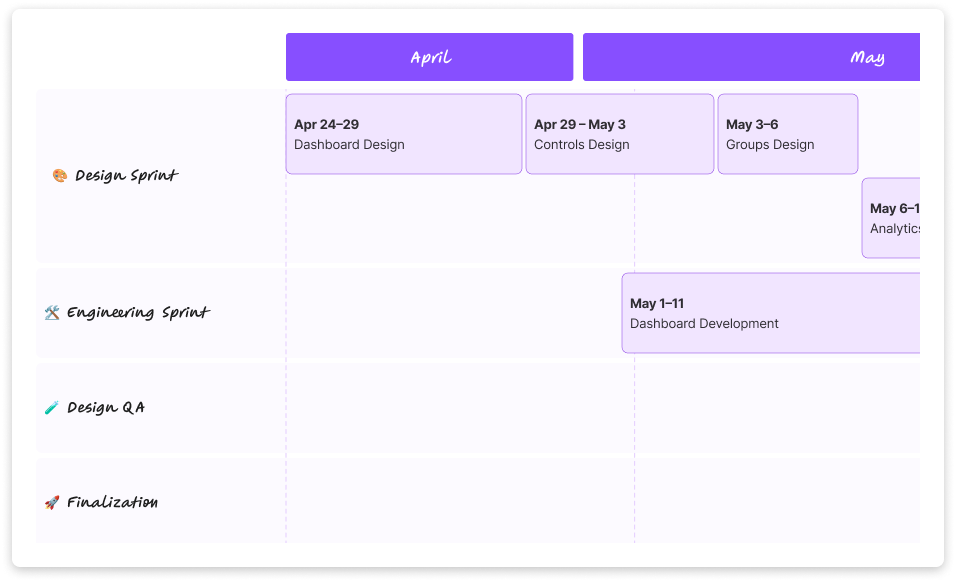
A commitment had been made to utility clients to deliver EV-related analytics, and the feature had to be demo-ready fast. I joined mid-project and had to ramp up quickly, collaborating across Product and Data teams to translate ambiguous requirements into a real, usable experience.

Team & sprint strategy

We had a tight timeline and a lean, cross-functional team: a PM, Data Analyst, EV subject-matter experts, engineering, and myself as the Lead UX/UI Designer. My role was to translate business and data requirements into a functional, intuitive interface—quickly and collaboratively. I worked closely with engineering to align on a N+1 sprint strategy, ensuring that design stayed just ahead of development without blocking momentum.

Initial sprint roadmap created collaboratively in FigJam to quickly align on a design-engineering plan. While official sprint planning was tracked in Jira, this visual served as a fast alignment tool between myself and the PM.
Facilitated a collaborative session to generate targeted user research questions, organized by feature area. Helped align the team on key assumptions and knowledge gaps ahead of user interviews.

Research

To ramp up quickly, I partnered with the PM to understand the limitations of available utility data and clarify any utility-specific requirements. This helped ensure the product would address real user needs while aligning with operational constraints.

I conducted user interviews to develop mental models that guided early feature design and helped align the team on key priorities.

Additionally, I reviewed previous brainstorms and internal ideation artifacts to ground my design work in existing context and accelerate team alignment.

Facilitated a collaborative session to generate targeted user research questions, organized by feature area. Helped align the team on key assumptions and knowledge gaps ahead of user interviews.

Product requirements

Collaborated closely with the Product Manager to define the feature requirements for the Electric Vehicles (EV) experience. Conducted requirement-gathering sessions to align on user needs, business goals, and technical constraints.

Translated high-level ideas into detailed product specifications, including user stories and acceptance criteria.

Helped scope the initial release by prioritizing features based on impact and feasibility, ensuring a focused and achievable MVP.

Table of scoped product requirements for the Electric Vehicles feature, including key sections, features and content needs.
Information architecture map of the Electric Vehicles feature, outlining structural relationships between pages, components, and user actions to guide design strategy.

Information architecture

To translate the product requirements into actionable design work, I created an information architecture (IA) map for the Electric Vehicles feature.

This visual framework helped define the structure, relationships, and hierarchy of key components—enabling the team to align on scope, identify gaps, and streamline decision-making.

The IA served as a bridge between product planning and design execution, allowing us to map out user flows and anticipate design implications early on.

Information architecture map of the Electric Vehicles feature, outlining structural relationships between pages, components, and user actions to guide design strategy.

User flows

With the information architecture in place, I mapped out key user flows to visualize how users would interact with the Electric Vehicles feature across various scenarios.

These flows helped clarify step-by-step actions, system behaviors, and edge cases—ensuring we designed with both usability and technical feasibility in mind.

Collaborating closely with engineering and product, I used these flows to identify critical touchpoints, reduce friction, and align the team around a shared user journey before moving into wireframes.

Generated multiple user flows to explore key interactions before moving into design solutions.

Data visualization

I collaborated with Data Analysts to map data types to appropriate chart styles, ensuring clarity and accuracy. A visual taxonomy of key data categories and user tasks guided our selection based on cognitive ease, data shape, and interactivity, resulting in intuitive and effective visualizations.

Dynamic tables

We introduced a new table pattern featuring toggle functionality to manage group-level load actions. The design supports dynamic states, real-time decision-making, and system feedback. To ensure clarity, confirmation modals were integrated to highlight the impact of key user actions before changes are applied.

Enrollments

For the enrollments section, I focused on simplicity and clarity by using familiar, easily scannable chart types. Given the straightforward nature of the metrics—such as new enrollments and unenrollments—the design prioritized quick comparisons and minimized visual friction to enhance user understanding.

Rapid iterations

To support fast-paced collaboration, I worked closely with the PM, who would sketch chart adjustments to reflect realistic data behaviors. This hands-on approach enabled quick design iterations and reduced back-and-forth. Accuracy was key, as the prototype was used in live demos with utility partners—so we prioritized rapid feedback loops to validate assumptions and build trust in the final output.

Prototype

Built a polished, interactive prototype in collaboration with PM and Sales/Marketing to support storytelling for client demos and internal buy-in. Included micro-interactions such as toggle switches, scroll-based behavior, snackbar/toast messages, and tooltips to reflect realistic user flows and data-driven scenarios.

Handoff & delivery

Since the feature leveraged existing design system components, minimal redlining was required. I focused on annotating new interaction patterns—such as toggle behaviors and dynamic tables—to ensure clarity around functionality.

To support development, I documented key user flows and edge cases directly within the handoff screens.

During delivery, I performed design QA in the staging environment, reviewing the implementation of interactive elements like tooltips, modals, and loading states.

Outcome

The feature was delivered on time, meeting both client expectations and internal milestones. It was approved by stakeholders and showcased in client demos, where it received positive feedback for its clarity and the depth of insights it enabled. Beyond its immediate value, the project set a precedent for future fast-paced, data-driven initiatives, highlighting the importance of close collaboration, iterative design, and rapid feedback loops.

Reflections

    Adapting to system constraints strengthened design discipline.
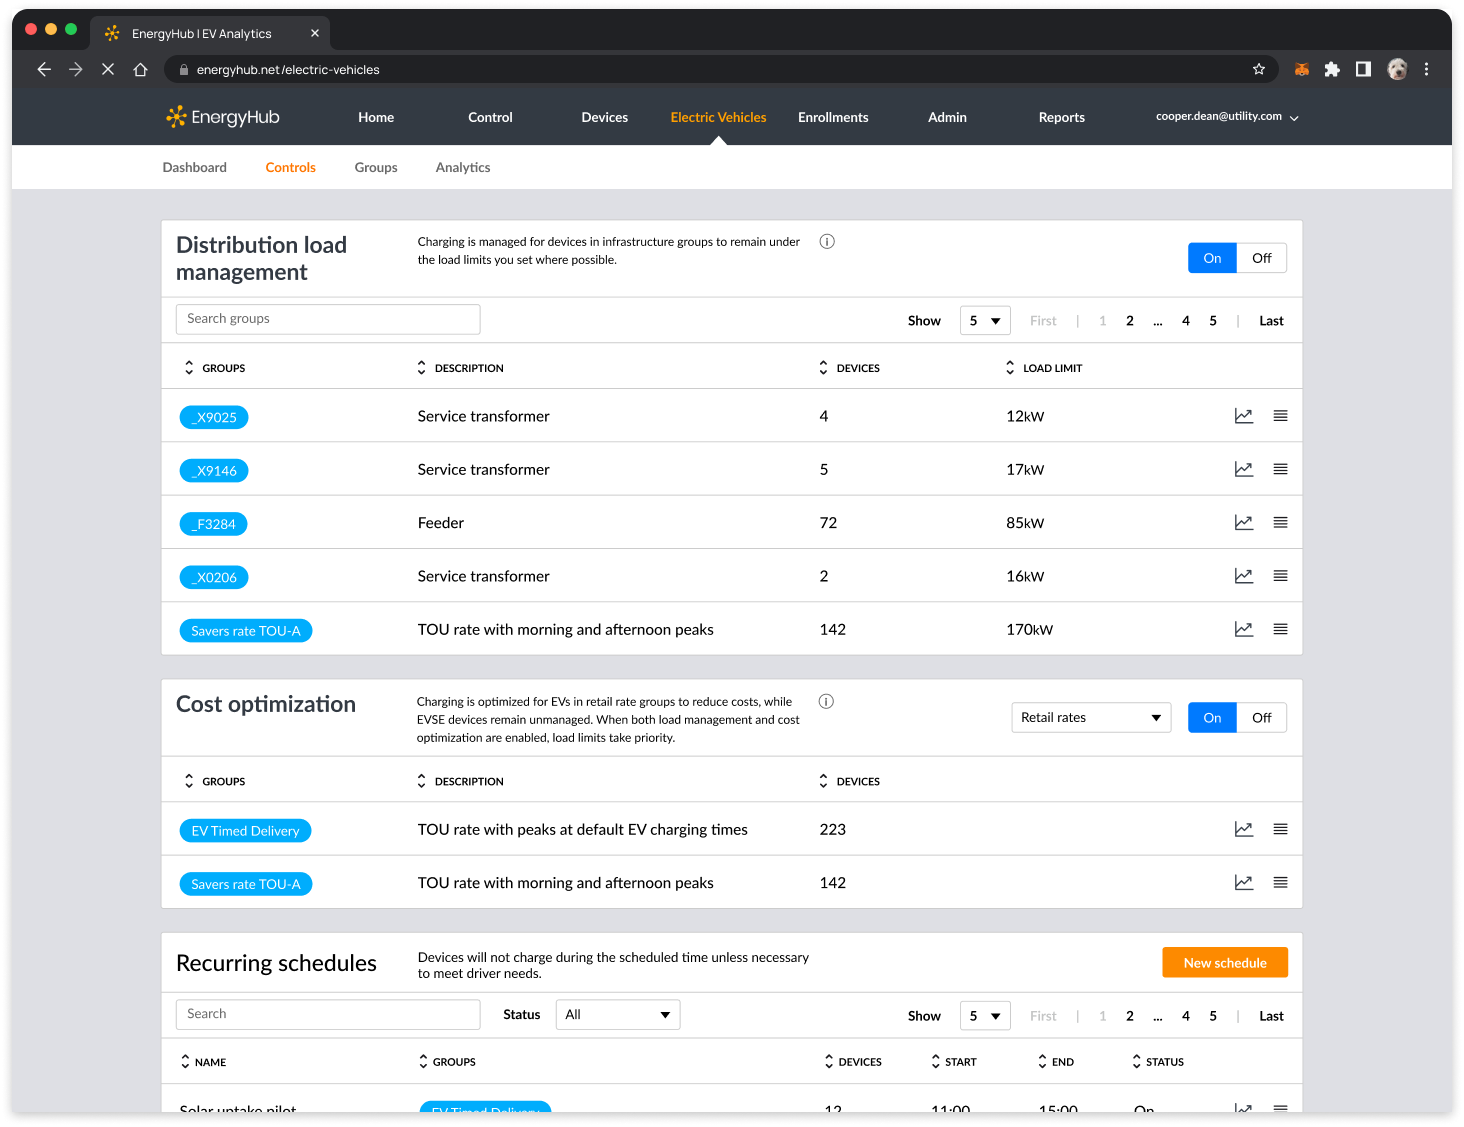
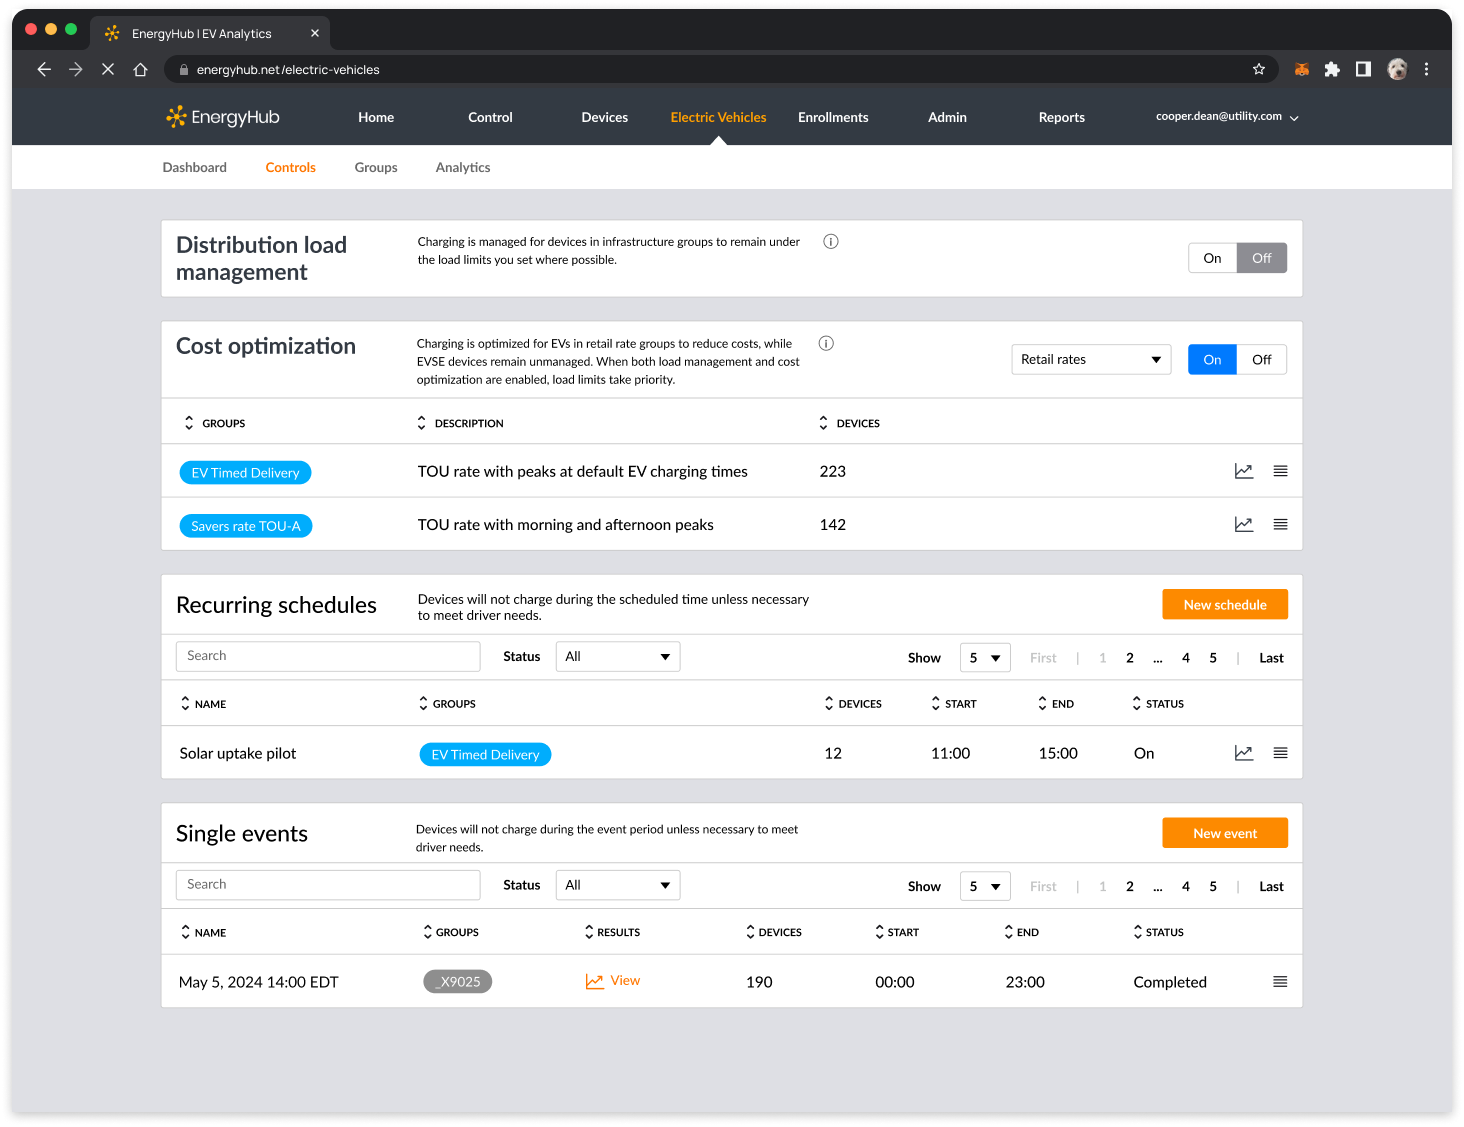
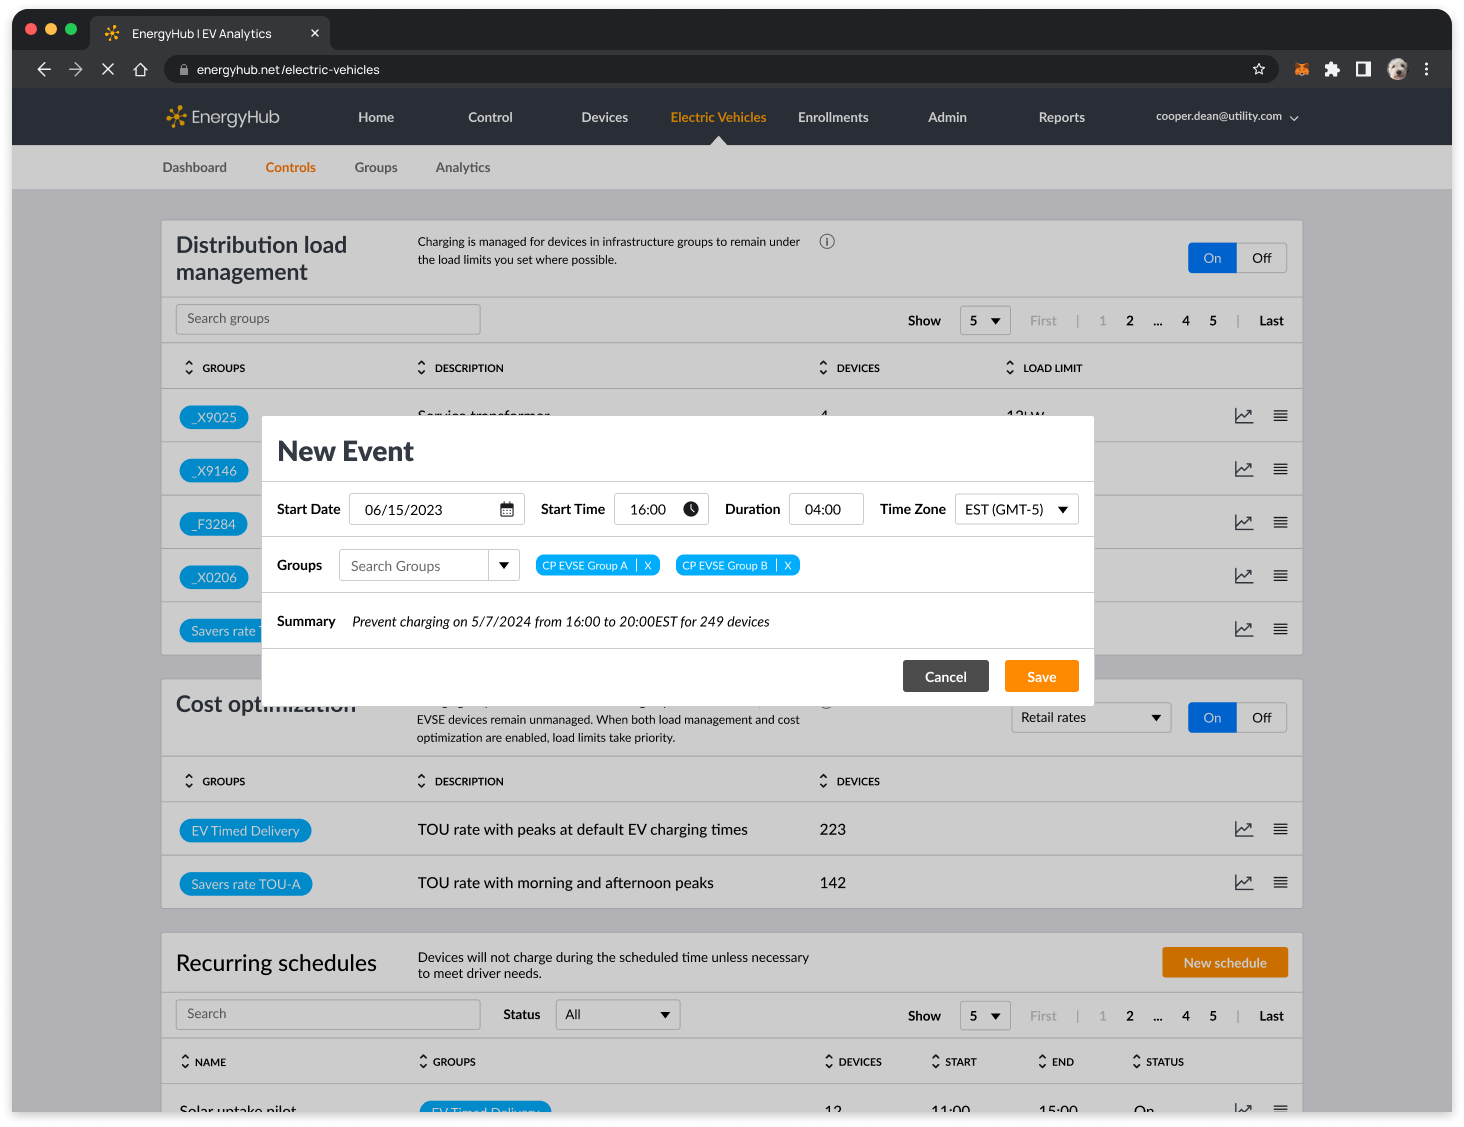
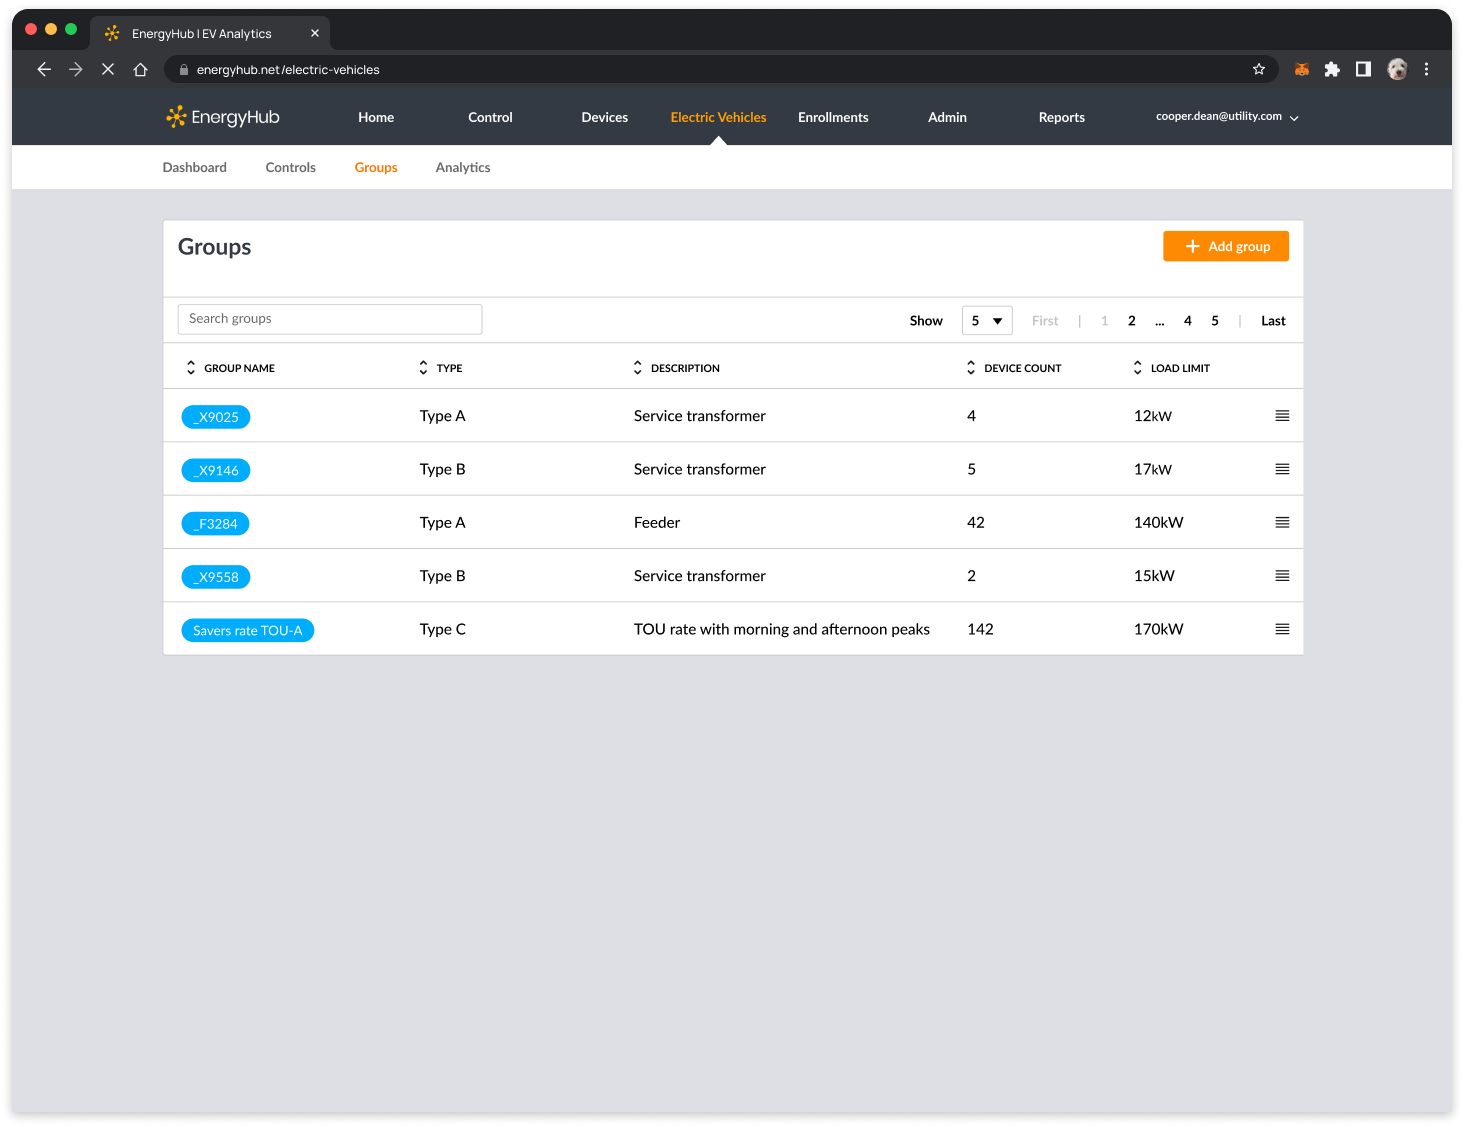
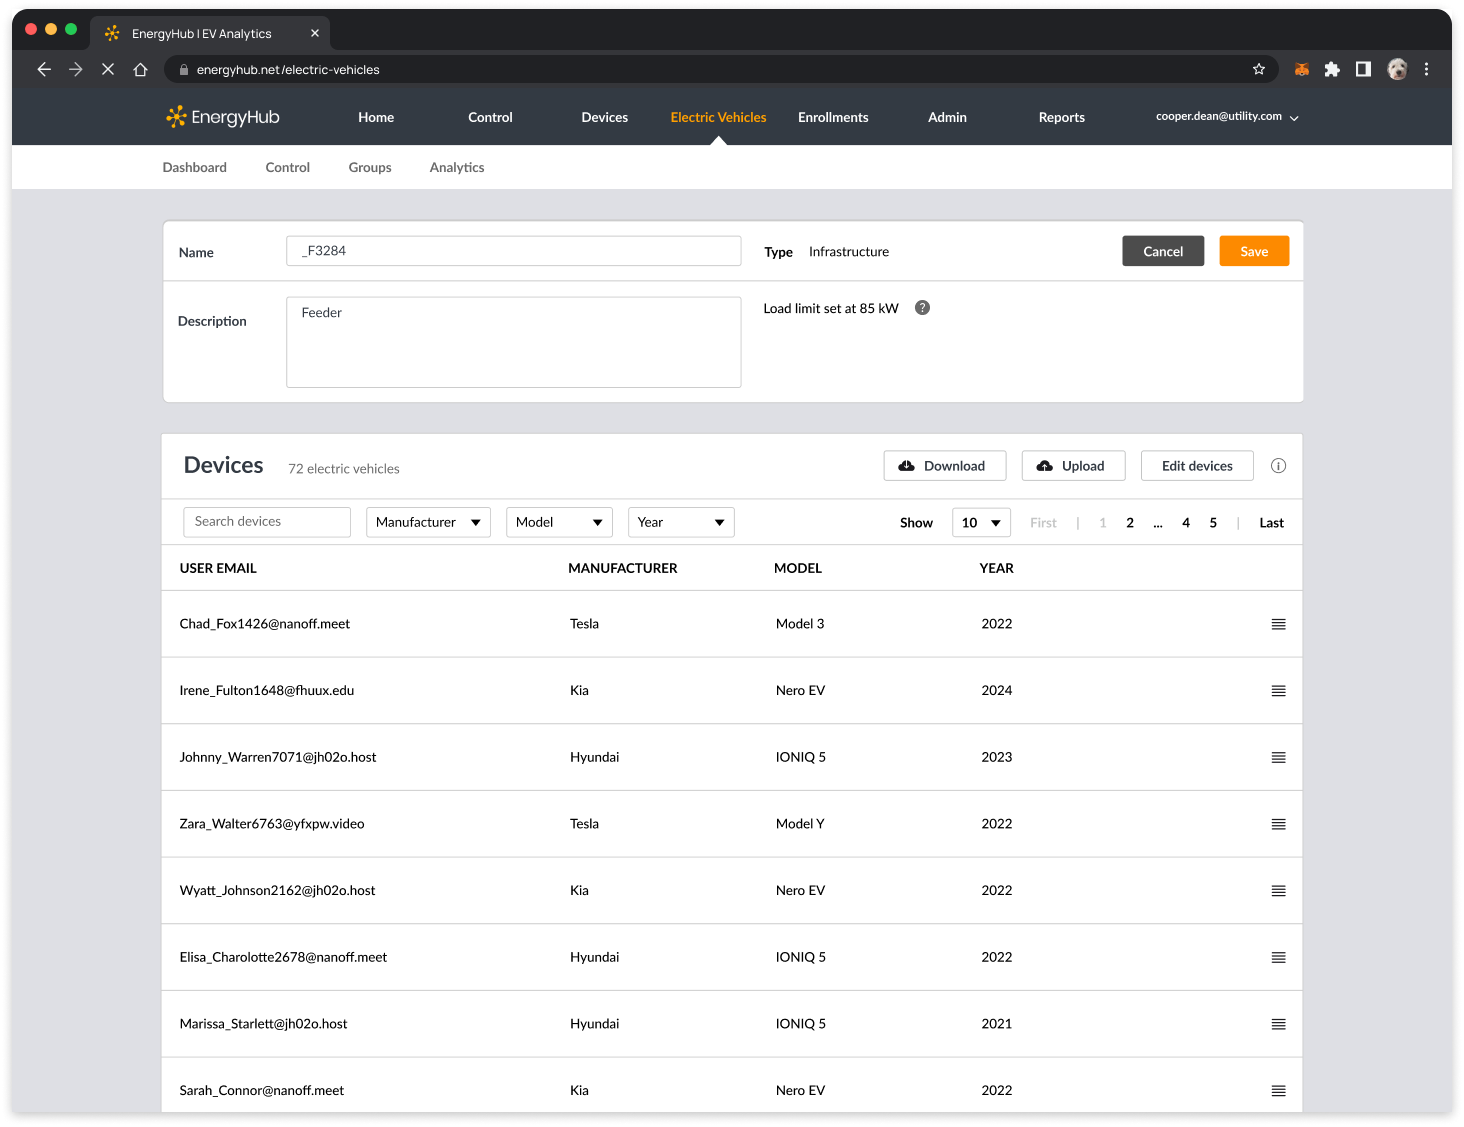
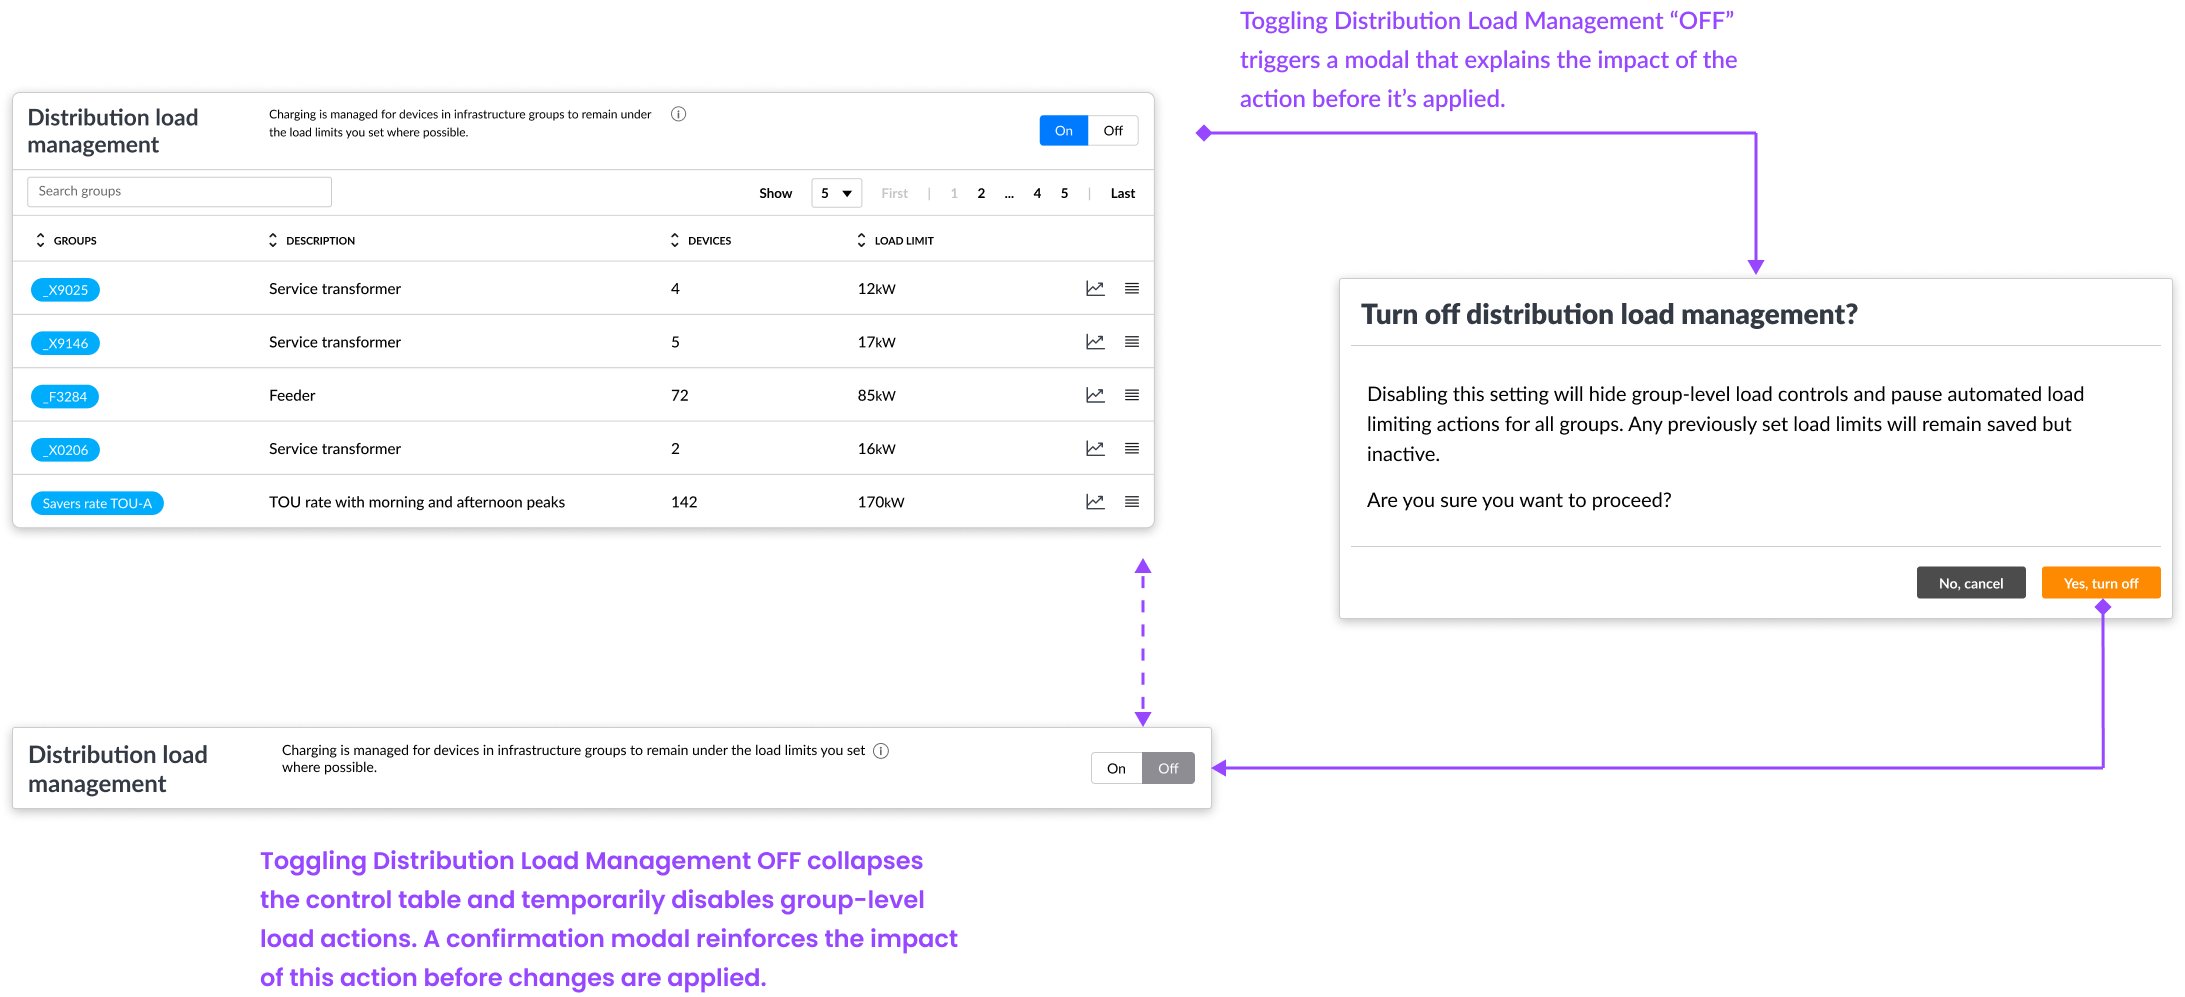
  • I couldn’t use the new Figma design system I had developed and instead worked within UWP’s existing component library. This limited flexibility in layout and interaction patterns, but pushed me to work efficiently within constraints and clearly annotate new behaviors—like dynamic tables and toggles—for engineering clarity.
  • Tight timelines reinforced the value of fast, collaborative iteration.
  • Given the accelerated timeline, the PM and I stayed tightly aligned, iterating quickly and using real data early to reduce rework. This real-time collaboration helped us maintain momentum and build a stronger, more accurate prototype.
  • Internal expertise helped offset limited research time.
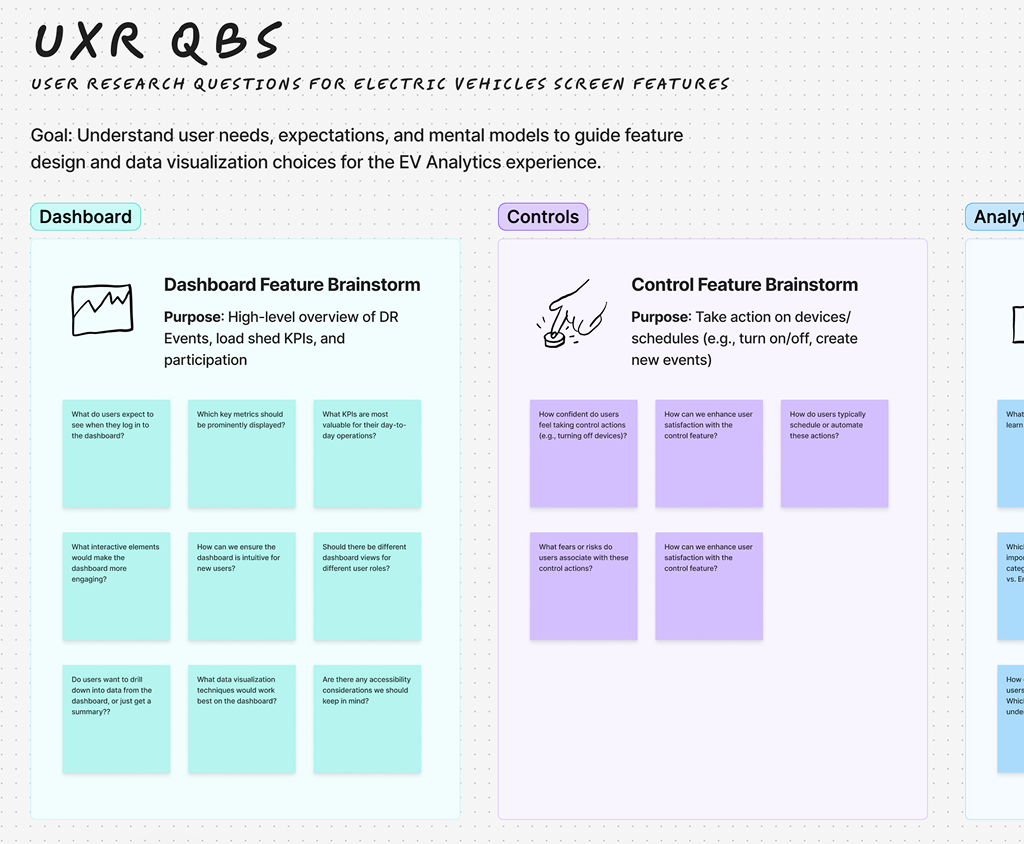
  • While there wasn’t time for formal user research, tapping into internal SMEs helped validate assumptions and keep decisions grounded. It underscored how targeted, scrappy inputs can still lead to informed design in fast-paced settings.

Final designs